

Learn how to translate technical initiatives into business outcomes, present IT roadmaps to the board, and secure executive funding with real-world examples.
Introduction: The Funding Gap in Modern IT
In the modern enterprise, the disconnect between IT departments and executive leadership is rarely a matter of technical incompetence. Instead, it is a language barrier. For many IT leaders, a roadmap is a comprehensive list of necessary upgrades, security patches, and infrastructure refreshes—a technical “shopping list.” For the CEO and the board, however, that same document looks like a black hole of capital expenditure with no clear return on investment (ROI).
When an IT roadmap reads like a shopping list, it rarely gets funded. Executives do not approve lists; they approve outcomes. They fund plans that protect revenue, reduce material risk, keep operations steady, and build customer trust. To bridge this gap, IT leaders must transition from being “order takers” to “strategic partners.” This transformation begins with a fundamental shift in how technology initiatives are presented, prioritized, and governed.
“A fundable IT roadmap is a business plan with technology inside it, not a technology plan hoping the business will care.” [1]
Phase 1: Translating Technical Initiatives into Business Outcomes
The most critical step in securing executive funding is the “So What?” test. Every technical project, no matter how complex, must be translated into a business outcome that the executive team already values. If a project cannot be mapped to a strategic business goal—such as growth, efficiency, or risk reduction—it is likely to be the first item cut during budget negotiations.
The “So What?” Test in Action
Consider a common IT request: “We need to migrate our legacy on-premise servers to the cloud.” To a technical lead, the benefits are obvious—scalability, reduced maintenance, and modern architecture. To a CFO, this sounds like a complex migration with uncertain costs. To pass the “So What?” test, the initiative must be reframed. Instead of “cloud migration,” the pitch becomes “Reducing our data center footprint to lower operational overhead by 15% and enabling the rapid launch of new customer-facing digital products.”
Outcome Mapping Table
To assist in this translation, IT leaders should utilize an Outcome Mapping Table. This tool ensures that every technical effort is tied directly to an executive value proposition.
| Technical Initiative | Business Outcome Theme | Executive Value Proposition |
|---|---|---|
| Cloud Migration (Lift & Shift) | Operational Efficiency | Reduce data center footprint by 40% and shift CAPEX to OPEX for 15% annual savings. |
| Zero Trust Implementation | Risk Mitigation | Protect revenue by reducing the risk of a multi-day outage from a single compromised credential. |
| Legacy ERP Upgrade | Business Growth | Enable real-time inventory tracking to support a 20% increase in e-commerce volume. |
| Data Lake Consolidation | Strategic Decision-Making | Shorten the monthly financial close cycle from 10 days to 3 days via automated reporting. |
| DevSecOps Pipeline | Speed to Market | Accelerate feature release cycles by 50% while maintaining 99.9% deployment stability. |
Phase 2: The “Run, Grow, Protect” Framework for IT Budgeting
One of the most effective ways to lower friction during budget discussions is to align IT spending with existing financial instincts. The Run, Grow, Protect model is a simple yet powerful framework that categorizes technology investments in a way that resonates with CFOs and boards.
1. Run: Operational Excellence (The “Tax”)
The “Run” category includes everything required to keep the lights on. This covers server maintenance, help desk operations, software licensing, and baseline cloud consumption. While often seen as a “tax” on the business, this is the foundation of operational stability. The goal here is efficiency—how can we maintain current service levels at a lower unit cost?
2. Grow: Strategic Expansion (The “Engine”)
The “Grow” category is where IT becomes a revenue driver. These are initiatives that add new capabilities, such as launching a new mobile app, integrating a CRM to improve sales conversion, or deploying AI-driven customer insights. This is the “engine” of the company’s future growth and is typically the easiest category to fund, provided the ROI is clearly defined.
3. Protect: Resilience & Compliance (The “Insurance”)
The “Protect” category focuses on reducing material risk. This includes cybersecurity controls, disaster recovery, SOC-2 compliance, and identity management. While these initiatives may not drive revenue, they protect the brand’s reputation and ensure business continuity. Framing these as “insurance” against multi-million dollar outages or data breaches makes the investment non-negotiable.
The Funding Balance
| Category | Primary Goal | Example Initiatives | Executive Priority |
|---|---|---|---|
| Run | Operational Stability | Server maintenance, help desk, software licensing, cloud consumption. | Non-negotiable (The “Tax” of Doing Business) |
| Grow | Revenue & Expansion | New product launches, CRM integration, AI-driven customer insights. | High (The “Engine” of the Future) |
| Protect | Resilience & Compliance | Disaster recovery, SOC-2 compliance, ransomware protection, identity management. | Critical (The “Insurance” of the Brand) |
Phase 3: Building the Business Case (Beyond the Price Tag)
A successful business case for an IT roadmap requires more than just a quote from a vendor. It requires a narrative that makes the cost of inaction (COI) obvious. Executives are often more motivated by the risk of losing money or market share than the potential for incremental gains.
Problem Statements that Make Inaction Costly
A good problem statement makes waiting feel expensive. Use a simple template: Current State + Impact + Who Feels It + The Cost of Waiting 12 Months.
- Example: Aging ERP Infrastructure. “Our core ERP runs on an unsupported version (Current State), which means upgrades take 30% longer each quarter (Impact). This delays financial reporting for the CFO’s team (Who Feels It). If we wait another year, we risk a total system failure during the year-end close, potentially costing the company $2M in lost productivity and audit penalties (The Cost of Waiting).”
Factoring in “Shadow” Costs
Executives are wary of “budget whiplash”—unexpected costs that appear midway through a project. To build trust, your roadmap must account for:
- Implementation Effort: How much “change fatigue” will the staff experience?
- Data Migration & Cleanup: Often the most underestimated part of any digital transformation.
- Exit Costs: What does it cost to move away from the current vendor if the new solution fails?
By naming these “gotchas” upfront, you demonstrate a level of financial discipline that executives respect.
Phase 4: Presenting to the Board: The One-Page Strategy
Most IT roadmaps fail in the boardroom, not because the plan is bad, but because the presentation is too dense. Board members are typically time-constrained and focused on high-level strategy, not technical implementation.
The 2-Minute Scan Rule
Your board-level roadmap should be scannable in two minutes and discussable in twenty. This means replacing 50-slide decks with a single, high-impact page. This page should highlight:
- Strategic Themes: 3-5 key pillars (e.g., Customer Experience, Cyber Resilience).
- Time Horizons: What is happening Now (0-6 months), Next (6-18 months), and Later (18+ months).
- Choices, Not Lists: Presenting a “Base” plan (fits current capacity) and an “Accelerated” plan (buys speed or reduces risk faster).
When you bring choices to the board, you invite partnership. When you bring a list, you invite cuts.
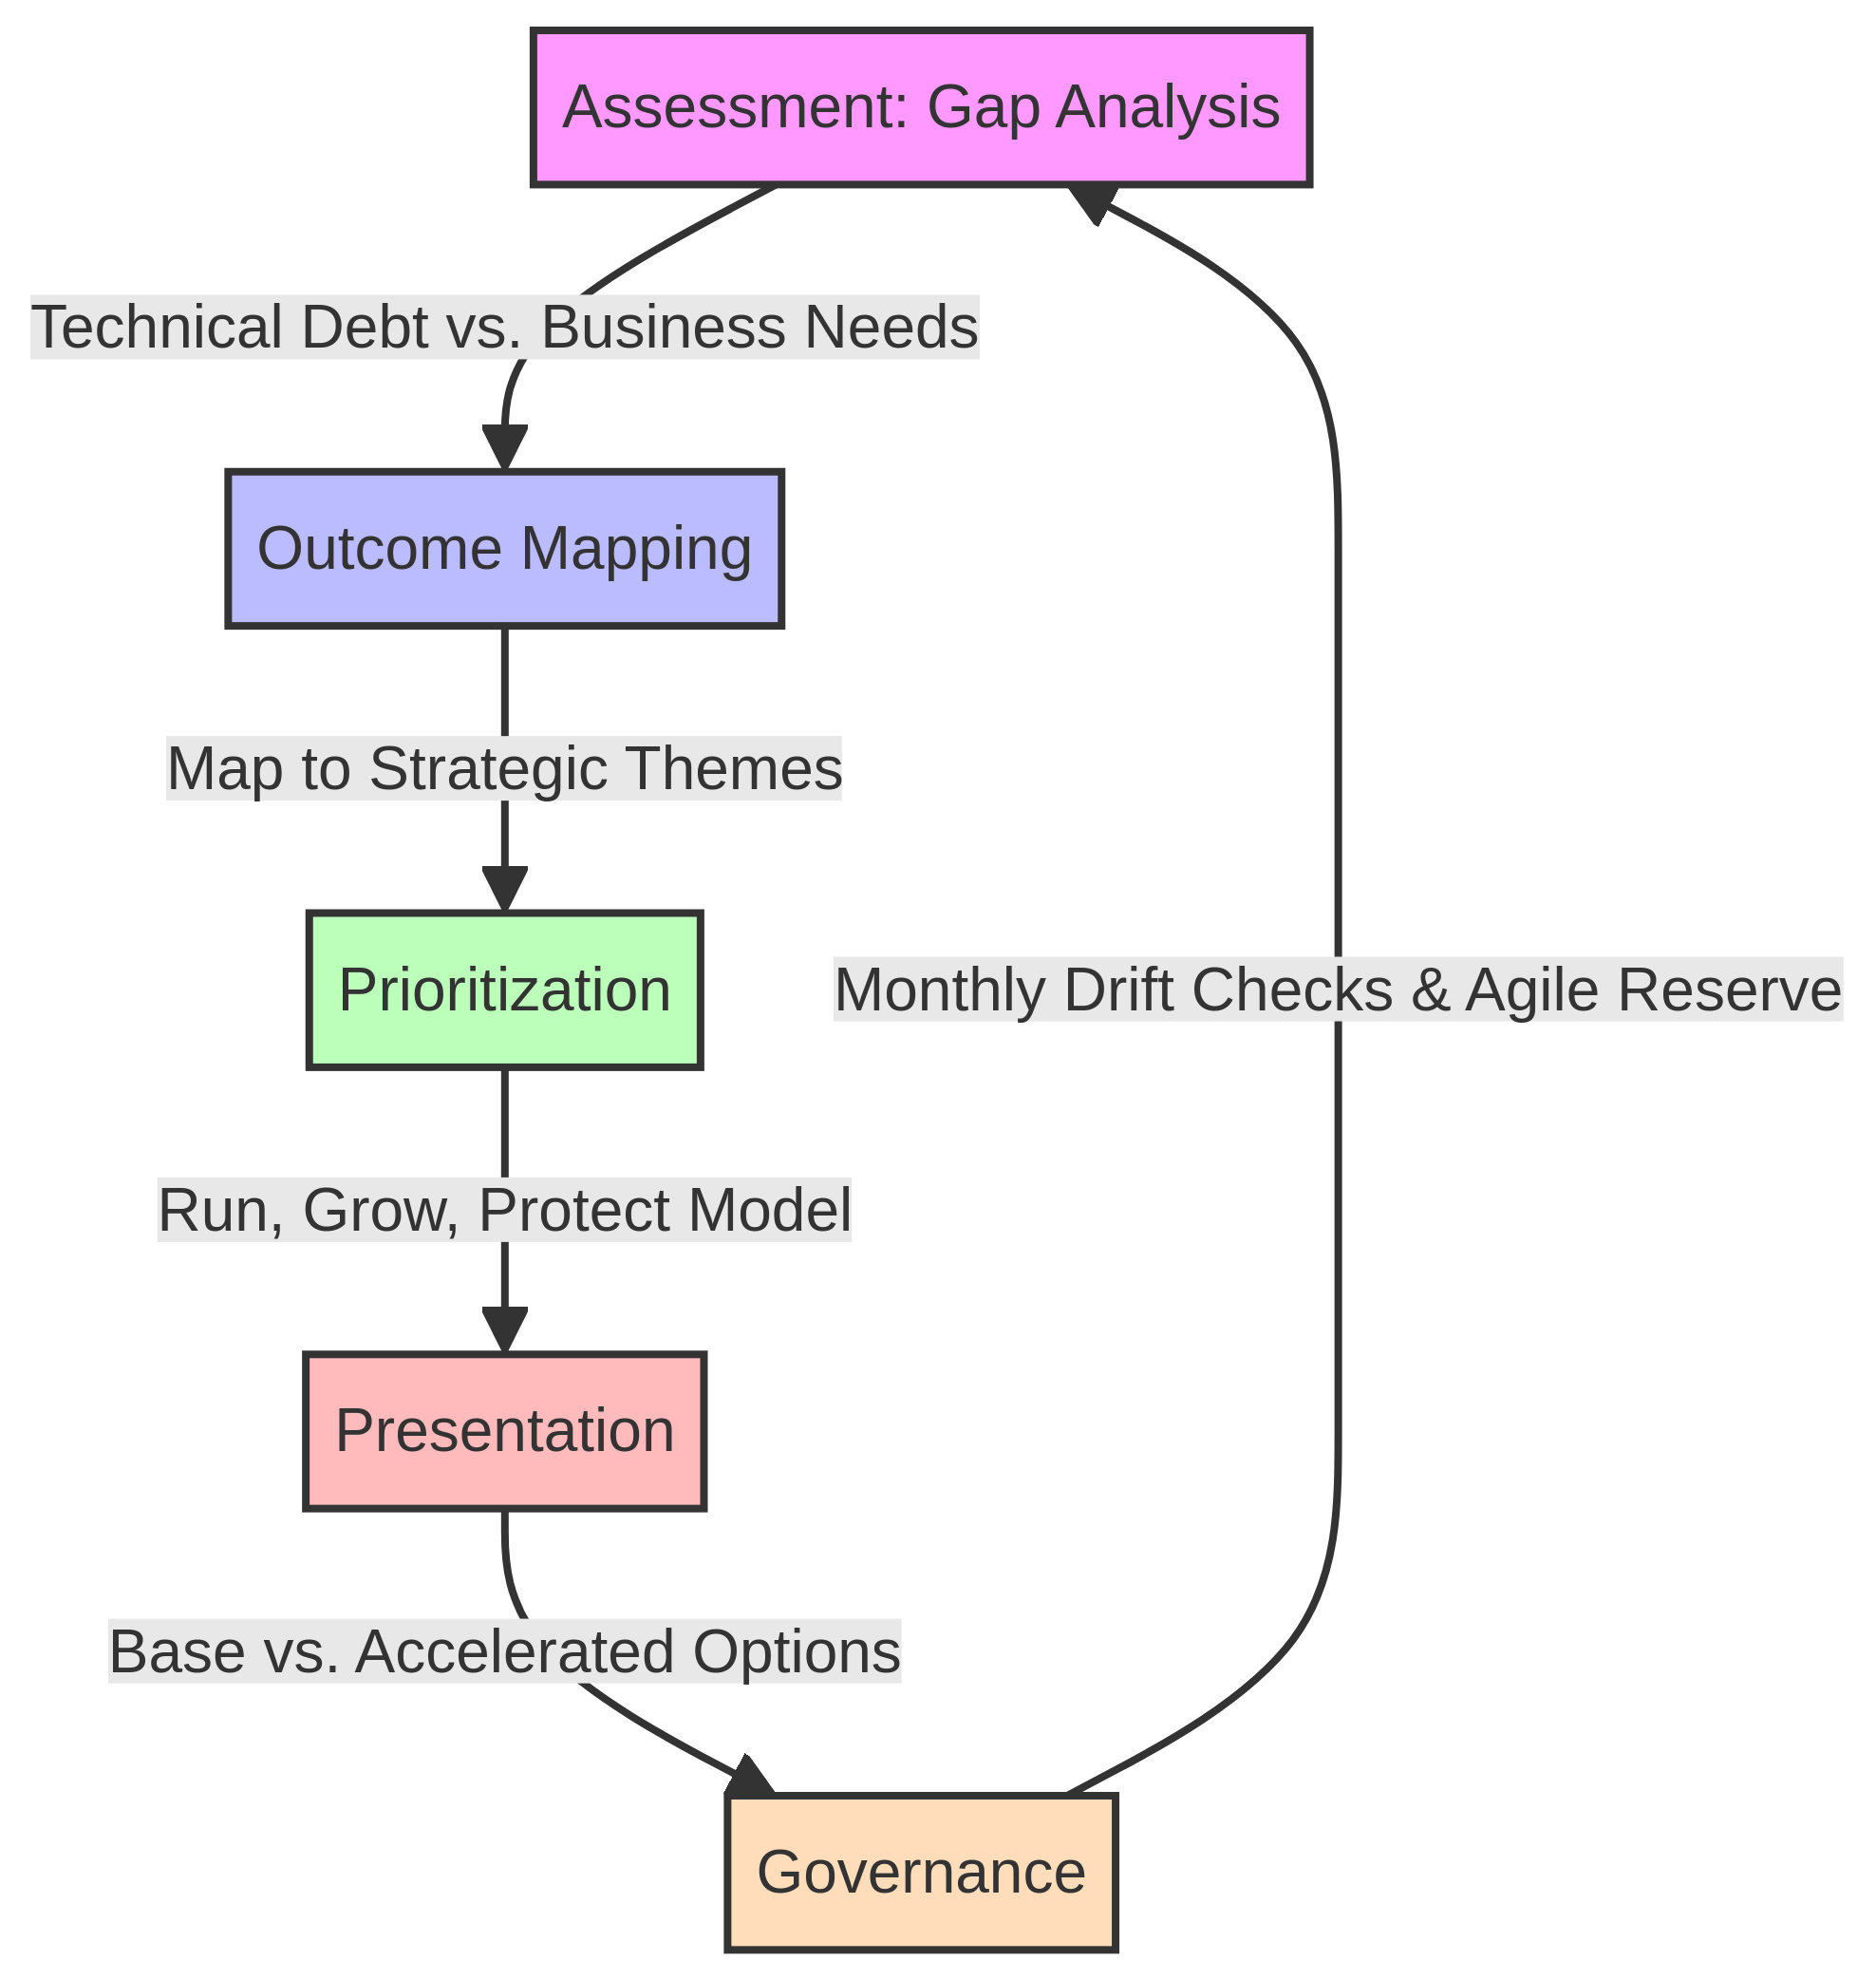
The IT Roadmap Lifecycle
Below is a diagram illustrating the iterative process of building and governing an effective IT roadmap.
Key Challenges and Evolving Trends in 2026
The landscape of IT roadmapping is shifting as we enter 2026. The traditional annual planning cycle is being replaced by more dynamic, agile approaches that can respond to rapid technological advancements and market shifts.
1. AI-Driven Roadmapping
One of the most significant trends is the integration of artificial intelligence into the roadmapping process itself. Organizations are now using AI to analyze their technical debt, predict maintenance needs, and even suggest project prioritization based on historical performance and business impact. This allows IT leaders to bring data-backed confidence to the board, moving away from “gut feel” to “data-driven” planning.
2. The Shift from Project to Product Mindset
Modern IT departments are moving away from one-off “projects” and toward a “product” mindset. In this model, IT initiatives are seen as ongoing investments that evolve over time. This shift is crucial for executive funding because it aligns with how businesses think about their own products and services. Instead of asking for a one-time budget for an ERP upgrade, IT leaders are asking for a persistent investment in a “Business Operations Platform” that continuously delivers value.
3. Resilience as a Competitive Advantage
In 2026, “Protect” is no longer just a defensive play. Resilience—the ability to recover quickly from an outage or cyberattack—is being marketed as a competitive advantage. Companies that can prove their systems are more reliable and secure than their competitors are winning more enterprise deals. This shift makes it easier to secure funding for disaster recovery and cybersecurity, as these are now seen as sales enablement tools.
Tool Review: Choosing Your Roadmapping Stack (2026)
Selecting the right tools is essential for creating a roadmap that is both strategically sound and operationally viable. In 2026, the market has bifurcated into two primary categories: strategic planning tools and operational tracking tools.
IT Roadmapping Tool Comparison (2026)
| Tool Category | Example Platforms | Best For | Key Executive Benefit |
|---|---|---|---|
| Strategic | Aha!, SharpCloud, Roadmunk | High-level planning, portfolio visualization, dependency mapping. | Visual clarity on “Now, Next, Later” horizons. |
| Operational | ServiceNow, Jira Advanced Roadmaps | Real-time tracking, resource allocation, technical task management. | Accuracy in delivery and resource capacity. |
| Collaborative | Miro, Lucidchart, Microsoft Visio | Initial brainstorming, process flow mapping, workshop-style alignment. | Fast consensus and cross-team alignment. |
Strategic Planning Tools: The “Why” and “What”
Tools like Aha! and SharpCloud are designed for the “C-suite view.” They allow IT leaders to visualize the connection between technical tasks and business goals. These platforms are excellent for board presentations because they focus on outcomes and dependencies rather than granular task lists.
Operational Tracking Tools: The “How” and “When”
Platforms like ServiceNow and Jira Advanced Roadmaps are where the actual work happens. These tools are essential for managing resource capacity and ensuring that the roadmap is actually achievable. They provide the “truth” that backstops the strategic vision.
Collaborative Whiteboarding: The “How We Get There”
For initial alignment and brainstorming, tools like Miro and Lucidchart remain indispensable. They allow cross-functional teams (IT, Finance, Operations) to map out processes and identify gaps in a low-friction, visual environment.
Real-World Case Study: Modernizing a Legacy ERP
To illustrate these concepts, let’s look at an anonymized example from a mid-sized manufacturing company that successfully secured funding for a multi-year ERP modernization project.
The Challenge
The company’s legacy ERP was over 15 years old. It was unstable, expensive to maintain, and lacked the features needed to support the company’s new e-commerce initiative. Previous attempts to secure funding for a “replacement” had been rejected by the board three times due to the high cost and perceived risk.
The Outcome-First Pitch
Instead of pitching an “ERP Replacement,” the CIO reframed the initiative as a “Digital Growth Platform.” The pitch focused on three strategic outcomes:
- Growth: Enabling real-time inventory synchronization with the new e-commerce site to support a projected 25% increase in online sales.
- Efficiency: Automating manual warehouse processes to reduce order fulfillment time by 40%.
- Risk: Moving the system to a secure cloud environment to eliminate the risk of a catastrophic on-premise hardware failure.
The Funding Strategy
The CIO used the Run, Grow, Protect model to show that while the “Grow” portion was a new investment, it would eventually reduce the “Run” costs by 20% over three years. They also presented a Base vs. Accelerated roadmap, allowing the board to choose between a three-year phased rollout or a two-year aggressive timeline.
The Result
The board approved the Accelerated roadmap, providing $4.5M in funding. By focusing on business outcomes and providing a clear choice of timelines, the CIO transformed a “technical debt” project into a “strategic growth” initiative.
Conclusion: From Cost Center to Strategic Partner
Building an IT roadmap that executives actually fund is not about having the most sophisticated technology; it’s about having the most effective communication strategy. By translating technical work into business outcomes, utilizing the “Run, Grow, Protect” framework, and presenting a clear, scannable vision to the board, IT leaders can secure the resources they need to drive real change.
In 2026, the most successful CIOs are those who can sit at the executive table and speak the language of risk, revenue, and resilience. They don’t just manage servers; they manage the digital future of the organization.
FAQ: Common Executive Questions on IT Roadmaps
1. How detailed should an IT roadmap be for the board?
At the board level, your roadmap should focus on strategic themes, high-level outcomes, and major risk milestones. Avoid technical jargon and granular task lists. Use the “Now, Next, Later” format to show direction without over-committing to specific dates in the distant future.
2. What if we need funding but are missing data for a perfect estimate?
Do not wait for perfect data. Instead, present cost ranges and clearly state your assumptions. Propose a short “Discovery Phase” (2-4 weeks) to refine the estimate. This demonstrates financial responsibility and prevents “budget whiplash” later on.
3. How do we handle “urgent” requests that show up mid-year?
The best approach is to maintain an “Agile Reserve”—typically 10-15% of your team’s capacity—for unplanned work. If a new request exceeds this, use a “Swap List” to show the board exactly which existing project will be delayed to accommodate the new request.
4. How do we prove the ROI of cybersecurity and infrastructure?
Refame these as “Business Continuity” or “Brand Protection” investments. Use metrics like “Reduction in Potential Downtime Cost” or “Compliance with Enterprise Customer Requirements.” Show that a secure, stable infrastructure is a prerequisite for all other “Grow” initiatives.
References
[1] Martin, Tyson. “How to Build an IT Roadmap That Actually Gets Funded.” LinkedIn, 5 Mar. 2026, https://www.linkedin.com/pulse/how-build-roadmap-actually-gets-funded-tyson-martin-lrq7e.
[2] Gartner. “2025 Technology Adoption Roadmap.” Gartner, https://www.gartner.com/en/information-technology/technology-adoption-roadmaps.
[3] TBM Council. “The Original TBM Framework.” TBM Council, https://www.tbmcouncil.org/framework-original/.
[4] NIST. “Cybersecurity Framework (CSF) 2.0.” National Institute of Standards and Technology, https://www.nist.gov/cyberframework.
[5] Forrester. “Developing A Winning Technology Strategy.” Forrester, https://www.forrester.com/technology/technology-strategy/.
Suggested Internal Link: 13th Octet – Expert IT Strategy and Implementation